


The Silicon-Water Nexus
From Location to System
The Dust Cloud Challenge began as a location problem: which of two candidate sites — Phoenix, Arizona or Ho Chi Minh City, Vietnam — should a leading semiconductor manufacturer choose for a $20-billion EUV-class mega-fabrication facility? That question quickly became a systems problem. What began as a comparison of permits and subsidies evolved into an investigation of how a single industrial installation restructures water rights, energy grids, community contracts, and long-range climate exposure across a thirty-year operating horizon.
The scale of the object under analysis is worth establishing. A mega-fab using extreme ultraviolet lithography — modeled here on TSMC Fab 21, currently the largest foreign direct investment in U.S. history — draws 5–10 million gallons of ultra-pure water per day, consumes 100–500 megawatts of electricity, and relies on nitrogen trifluoride for chip etching: a gas with a global warming potential 17,200 times that of carbon dioxide. The constraints are not incidental to the location decision. They are the analysis.
Between the two candidate sites, each failure mode was distinct. Vietnam offered lower labor costs and an emerging tech ecosystem, but a coal-dependent grid responsible for $1.4 billion in blackout losses in a single year and a coastline projected to face threefold flood depth increases by 2050. Arizona offered political stability and $52.7 billion in CHIPS Act subsidies, but a Colorado River at Tier 1 shortage and structural drought entering its second decade. The team chose Arizona — not because it was the obvious answer, but because it was the harder case: real constraints, granular data, and a genuine question of thirty-year viability.
What unfolds across the four diagrams is a silicon–water nexus: a tightly-coupled feedback architecture linking GRI 303 (Water), GRI 413 (Local Communities), and GRI 201 (Economic Performance). Each layer translates the same system into a more rigorous form — qualitative loops become discrete states, states become parametric equations, and equations become inputs for autonomous decision agents. The result is a single defensible chain of reasoning from narrative to simulation.
From narrative reasoning to simulated governance
Each layer below corresponds to one section of this page. They are read top-to-bottom: the CLD surfaces the feedback dynamics, the state machine sequences regime transitions, the parametric diagram quantifies the equations, and the multi-agent simulator demonstrates how those equations could be governed in real time.
The Silicon–Water Nexus
The qualitative entry point. Twelve system variables and six feedback loops — two reinforcing spirals (R1 Water Scarcity, R2 Social License Erosion) and four balancing loops (B1 Technology Pivot, B2 Federal Subsidy Buffer, B3 Energy Constraint, B4 Renewable Energy Buffer) — mapped across GRI 300s, 400s, and 200s with an Iceberg Model overlay surfacing events, patterns, structures, and mental models.
Five regimes, one absorbing endpoint
The CLD tells us what feeds back into what; the state machine tells us in what order. Five operational regimes — Stable, Stressed, Non-Compliant, In Recovery, Terminal — connected by guarded transitions tied directly to the parametric model’s constraint thresholds. The Terminal state has no exit arrow: once CHIPS disbursement falls below the 5% floor, the model treats it as absorbing.
The mathematical core
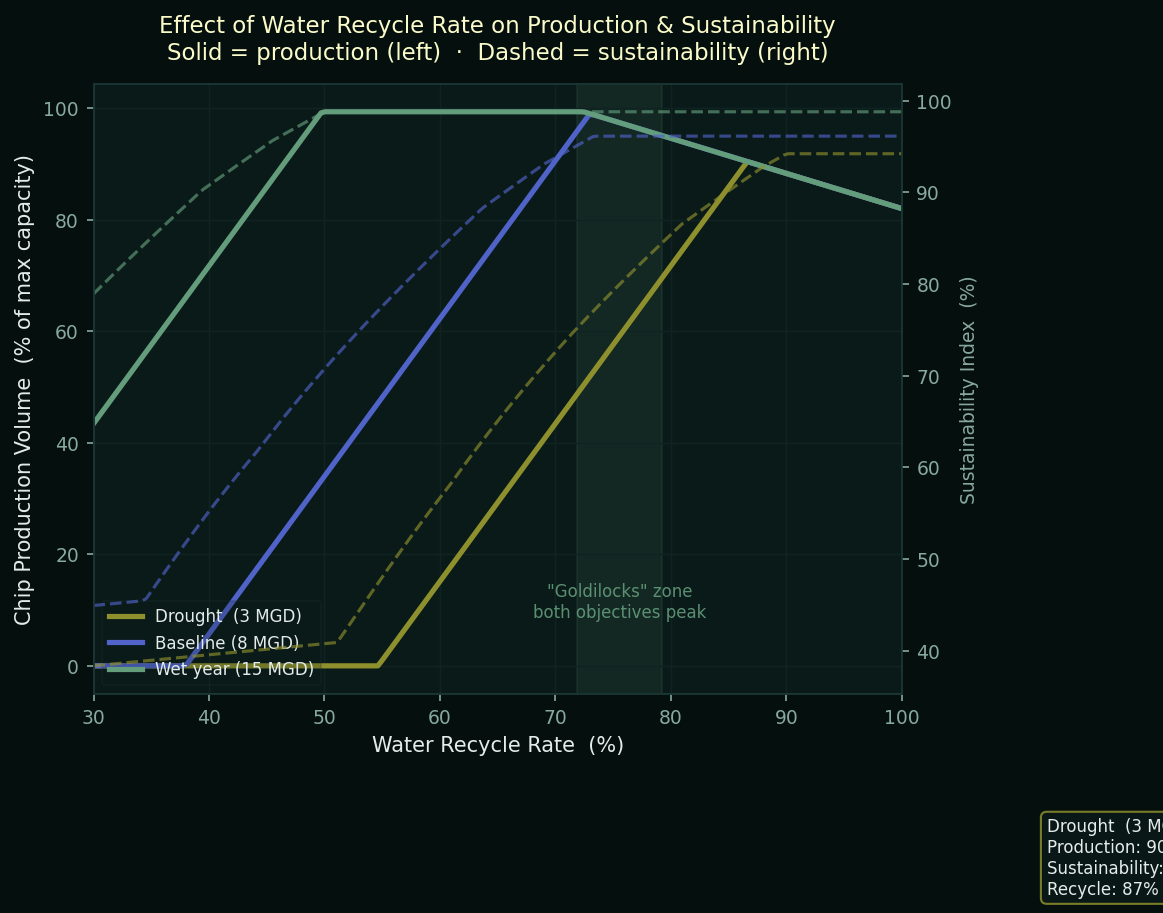
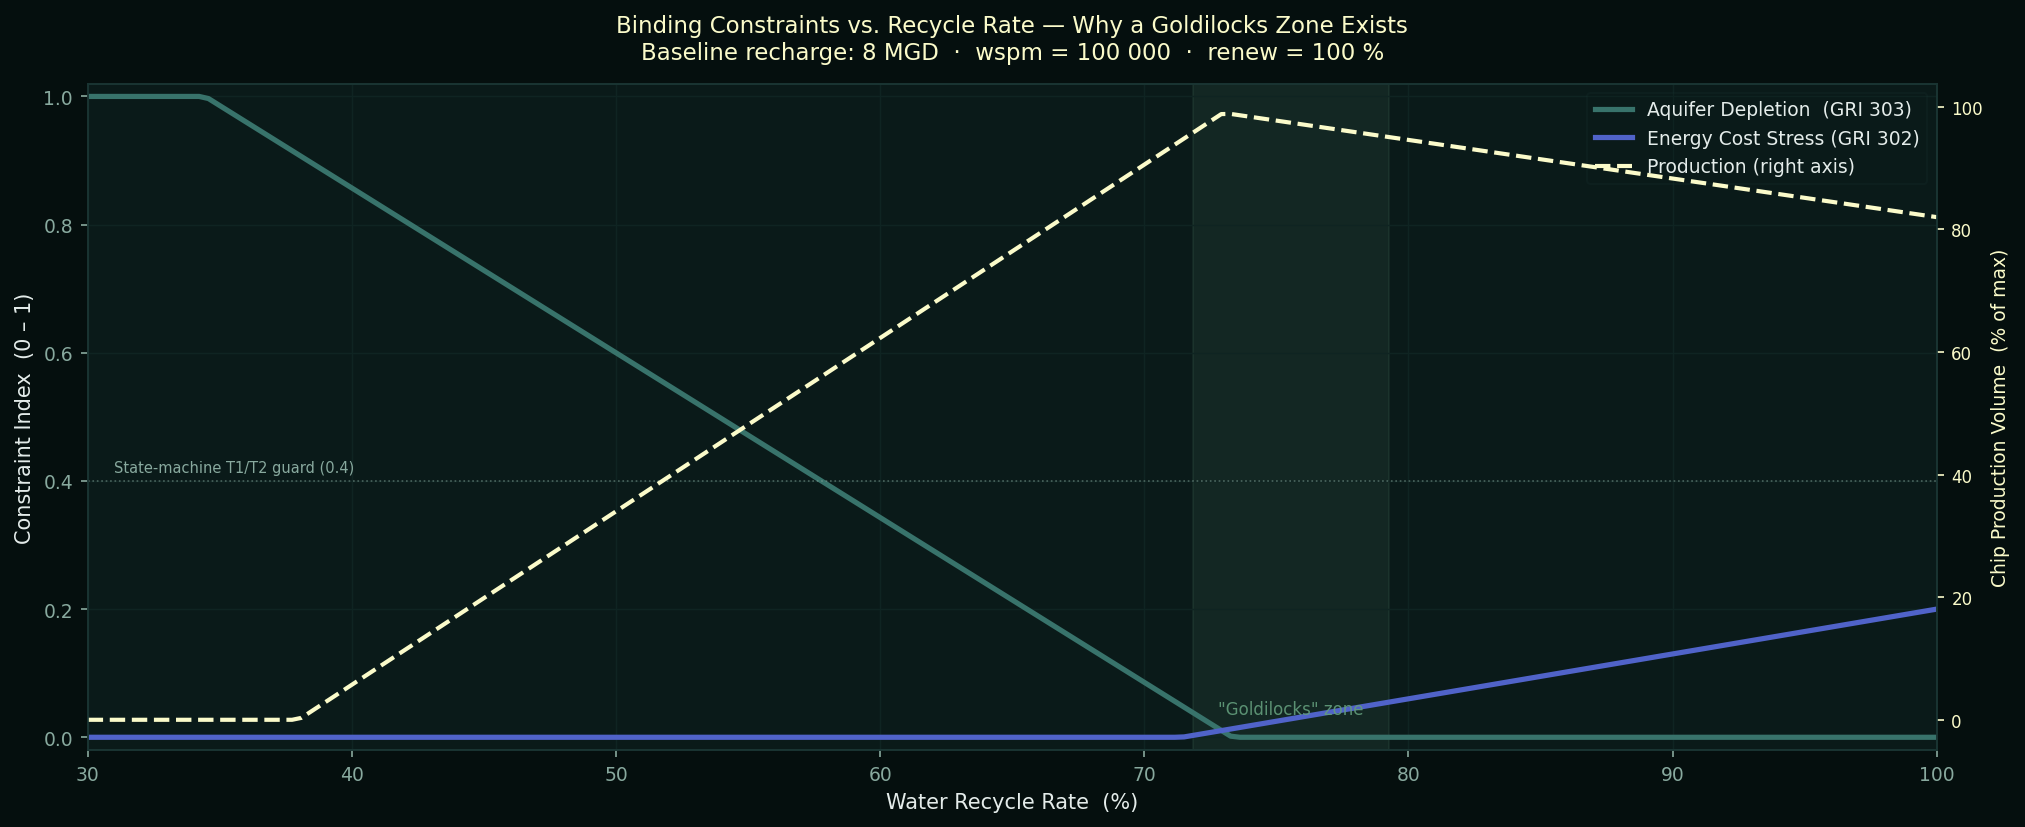
Five interdependent subsystems — Water, Energy, Production, Community, Economic — linked by constraint equations. WaterBalance and WaterStressIndex map to GRI 303; CommunityResistance and PermitRisk map to GRI 413; CHIPSFunding maps to GRI 201. Drag the sliders to see how a water-withdrawal increase cascades through community resistance into permit risk and CHIPS disbursement.